Molecular analysis for ovarian cancer detection in patient-friendly samples
Study population
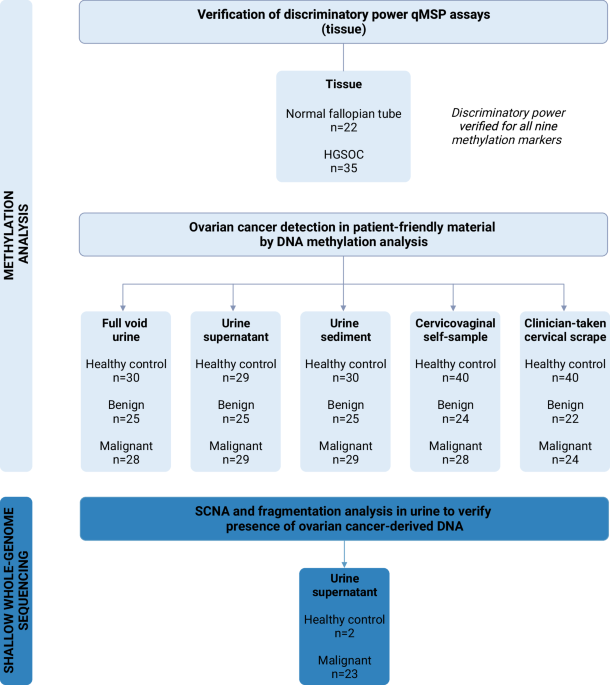
This study prospectively included patients with a highly suspicious ovarian mass according to current triage methods (>40% risk of malignancy using the IOTA adnex model)29.30. Paired samples (ie, urine, cervicovaginal self-samples, and clinician-taken cervical scrapes) were consecutively collected within the SOLUTION1 study, between July 2018 and September 2022, at the Antoni van Leeuwenhoek Hospital, Amsterdam, The Netherlands. Samples were collected from patients who underwent pelvic surgery with post-operatively confirmed ovarian cancer of any stage and histological subtype, and patients with a benign ovarian mass who were referred to a highly specialized tertiary oncology unit for further assessment. Patients scheduled for pelvic surgery, involving exploratory laparotomy to determine the origin of their ovarian mass or cytoreductive surgery, were asked to collect samples prior to surgery. Patients who could not collect cytological or urine samples prior to surgery were excluded from participation. Patients diagnosed with a borderline tumor were also excluded to focus on the most distinct tumor types in this exploratory stage (ie, benign and malignant ovarian masses). Patients were included in the study regardless of whether all three paired sample types were available or not. For example, if a cervical scrape was not collected, the urine and self-sample of this patient were still analyzed and included.
Control urine samples were obtained from the URIC biobank, including healthy women without any prior cancer diagnosis within the last 5 years. Control cervicovaginal self-samples and cervical scrapes were retrieved from leftover material of the Dutch national cervical cancer screening program. Healthy control samples were within the same age range as women diagnosed with an ovarian mass, and all tested negative for high-risk human papillomavirus (HPV). Information on prior benign gynecological disease and menopausal status was not documented for healthy control women. Yet, the majority of women were most likely postmenopausal with 93% of healthy control women aged over 50 years.
To verify the discriminatory power of the methylation assays and concordance of copy number profiles, formalin-fixed paraffin-embedded (FFPE) and fresh frozen high-grade serous ovarian cancer (HGSOC) tissue samples were retrieved from the Pathology archives of Amsterdam UMC, locations AMC and VUmc, Amsterdam, The Netherlands. FFPE normal fallopian tube tissues were collected from patients undergoing a hysterectomy for the treatment of benign endometrial conditions.
Ethics statement
Ethical approval was obtained by the Medical Ethical Committee of the VU University Medical Center for the use of samples collected within the SOLUTION1 study (METc: 2016.213, Trial registration ID: NL56664.029.16), samples stored in the URIC biobank (TcB 2018.657), and samples archived in the biobank containing leftover material of the Dutch national cervical cancer screening program (TcB 2020.245). Women participating in the screening program were informed that their residual cervical sample could be used for anonymized research and had the opportunity to opt-out. Only leftover material from women that did not opt out was used. All study participants were 18 years or older and signed informed consent before sample collection. The Code of Conduct for Responsible Use of Left-over Material of the Dutch Federation of Biomedical Scientific Societies was adhered to for the use of tissue specimens.
Sample collection, processing, DNA extraction, and bisulfite modification
The sample collection, processing, DNA extraction, and bisulfite modification procedures were carried out as described previously for cervical8.31 and endometrial cancer10.24. A detailed description is provided in the Supplemental Methods. Briefly, urine and cervicovaginal self-samples were collected at home and clinician-taken cervical scrapes were collected before surgery. Urine was centrifuged and separated into two fractions: the urine supernatant and the urine sediment. Both fractions and the remaining full void urine were stored for further analysis. Following DNA extraction, up to 250 ng of DNA was subjected to bisulfite modification.
DNA methylation analysis by quantitative methylation-specific PCR
Methylation levels of the C2CD4D (gene ID: 100191040), CDO1 (gene ID: 1036), GALR1 (gene ID: 2587), GHSR (gene ID: 2693), JUST (gene ID: 4118), NRN1 (gene ID: 51299), PRDM14 (gene ID: 63978), SST (gene ID: 6750), and ZIC1 (gene ID: 7545) genes were measured by quantitative methylation-specific polymerase chain reactions (qMSP). Methylation markers were multiplexed to assess the methylation levels of three genes (1: GHSR/SST/ZIC12: CDO1/MAL/PRDM143: C2CD4D/GALR1/NRN1) and a reference gene (ACTB, gene ID: 60) within the same reaction. Methylation analysis of CDO1, GALR1, GHSR, JUST, SST, PRDM14etc ZIC1 was performed as described previously10,23,24 with a shortened amplicon size of ACTB, JUST and ZIC1 to facilitate methylation detection in fragmented urinary DNA. Assay targeting C2CD4D and NRN1 were designed based on gene loci discovered and validated by others17.26. Primer and probe information is provided in Supplemental Table 1. Reaction conditions, instrument identifications, and thermocycling parameters are described in the Supplemental Methods. Double-stranded gBlocks™ Gene Fragments (Integrated DNA Technologies) containing the target amplicons and H2O were taken along in each run as positive and negative control, respectively. Sample quality and sufficient input was ensured by excluding samples with a ACTB quantification cycle (Cq) ≥ 32. Methylation levels were calculated relative to ACTB levels by the comparative Cq method: 2^ -(Cq marker – Cq ACTB) × 10032.
All qMSP assays were designed, multiplexed and optimized according to parameters described earlier33. Target specificity was validated in silico (BLAST). Correct amplicon size was verified by agarose gel electrophoresis. Analytical validation was performed using a dilution series of bisulfite-treated methylated DNA from the SiHa cell line (100, 50, 10, 5, 1, 0.5%) within the range of 20–0.1 ng (Supplemental Table 2). The discriminatory power of each assay was verified by comparing methylation marker levels in tissue samples of ovarian cancer patients with those measured in normal fallopian tube tissue.
Shallow whole-genome sequencing
Urine cell-free DNA (cfDNA) extracted from urine supernatant samples of ovarian cancer patients was further characterized by shallow whole-genome sequencing (~1× coverage). The cfDNA was quantified and analyzed using a Cell-free DNA ScreenTape assay of the Agilent 4200 TapeStation System (Agilent) for quality control before sequencing. Sequencing libraries of the first pilot series of urine supernatant DNA were prepared using the ThruPLEX Plasma-seq Kit (Takara Bio, Mountain View, CA, USA) for whole-genome sequencing according to the manufacturer’s instructions. The remaining samples were prepared using the NEBNext® Enzymatic Methyl-seq (EM-seq) Kit (NEB, Ipswich, MA, USA). EM-seq was performed according to manufacturer’s guidelines for standard insert libraries with 14 PCR cycles. Libraries were quantified and quality-checked using the D1000 ScreenTape Analysis Assay (Agilent) before pooling. Paired-end 150 base pair (bp) libraries were pooled in equimolar amounts and sequenced on a NovaSeq6000 (Illumina) (GenomeScan, Leiden). The processing of sequencing data and subsequent analysis of SCNA and cfDNA fragmentation patterns are provided in the Supplemental Methods. Shallow whole-genome sequencing of paired FFPE primary tumor tissue was performed to verify copy number profile concordance and is also described in the Supplemental Methods.
Statistical analysis
Methylation levels were expressed as 2logtransformed Cq ratios and presented in violin plots. Tissue methylation levels were compared between two groups using the non-parametric Mann–Whitney U test. Methylation levels of each gene in the remaining sample types were compared between healthy controls and patients diagnosed with a benign or malignant ovarian mass using the Kruskal–Wallis test. In the case of a significant Kruskal–Wallis test (P < 0.05), this was followed by post-hoc testing of (1) healthy controls versus malignant ovarian masses, and (2) benign versus malignant ovarian masses using the Mann–Whitney U test with Bonferroni correction.
The correlation between methylation levels of each DNA methylation marker between paired samples of patients diagnosed with ovarian cancer was assessed using Spearman’s rank correlation. Correlation coefficient r was defined as very weak (r = 0.00–0.19), weak (r= 0.20–0.39), moderate (r= 0.40–0.59), strong (r= 0.60–0.79), or very strong (r= 0.80–1.00) and displayed in correlation matrices.
Fragment size profiles were visualized by density plots and analyzed by comparing cfDNA reads of healthy controls and ovarian cancer patients with low (<5%) and high (≥5%) tumor fractions.
Data were collected using Castor EDC and analyzed using R (version 4.0.3 with packages: cowplot, corrplot, dplyr, ggplot, ggpubr, and rstatix). Pvalues are two-sided and considered statistically significant when P< 0.05. Reported Pvalues are Bonferroni corrected when comparing >2 groups (ie, divided by the number of comparisons). Given the exploratory nature of this study, nine methylation markers were included without correction for multiple testing.
Reporting summary
Further information on research design is available in the Nature Portfolio Reporting Summary linked to this article.

Ethel Purdy – Medical Blogger & Pharmacist
Bridging the world of wellness and science, Ethel Purdy is a professional voice in healthcare with a passion for sharing knowledge. At 36, she stands at the confluence of medical expertise and the written word, holding a pharmacy degree acquired under the rigorous education systems of Germany and Estonia.
Her pursuit of medicine was fueled by a desire to understand the intricacies of human health and to contribute to the community’s understanding of it. Transitioning seamlessly into the realm of blogging, Ethel has found a platform to demystify complex medical concepts for the everyday reader.
Ethel’s commitment to the world of medicine extends beyond her professional life into a personal commitment to health and wellness. Her hobbies reflect this dedication, often involving research on the latest medical advances, participating in wellness communities, and exploring the vast and varied dimensions of health.
Join Ethel as she distills her pharmaceutical knowledge into accessible wisdom, fostering an environment where science meets lifestyle and everyone is invited to learn. Whether you’re looking for insights into the latest health trends or trustworthy medical advice, Ethel’s blog is your gateway to the nexus of healthcare and daily living.